Web Server Statistics for estate.trademore.com.ng
Program started on Sun, Sep 20 2020 at 1:15 PM.
Analyzed requests from Fri, Sep 04 2020 at 5:12 PM to Sat, Sep 19 2020 at 3:33 PM (14.93 days).
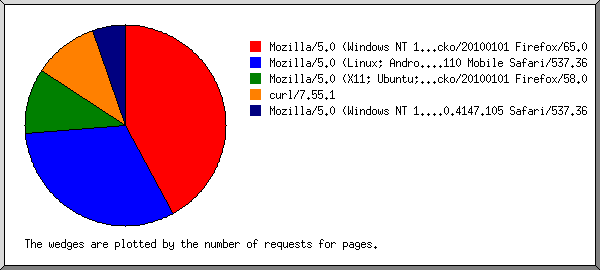
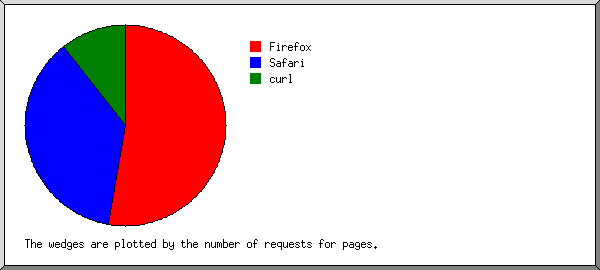
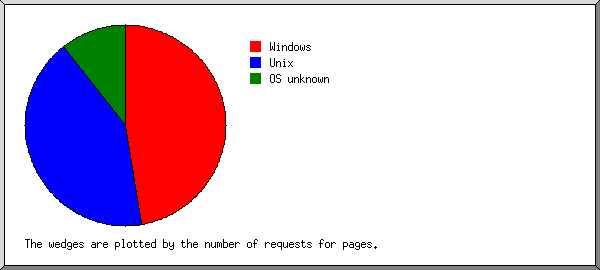
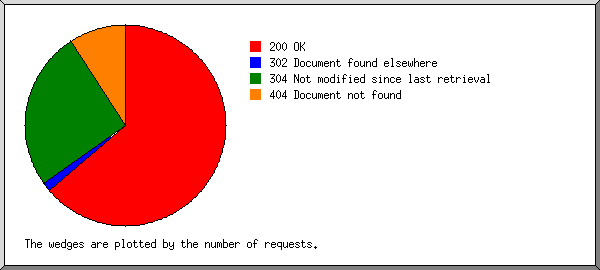
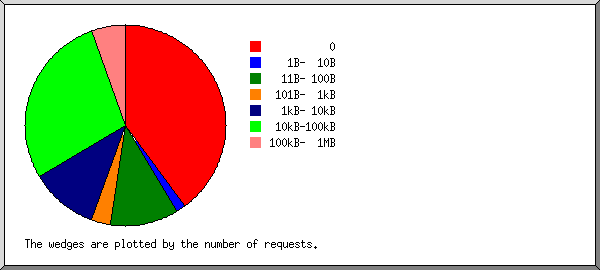
 ) represents 1 request for a page.