Web Server Statistics for wcia.portal-lms-cbt.com
Program started on Tue, Sep 28 2021 at 1:24 PM.
Analyzed requests from Tue, Sep 21 2021 at 1:26 PM to Tue, Sep 28 2021 at 10:29 AM (6.88 days).
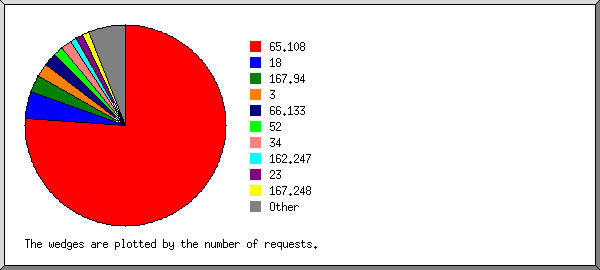
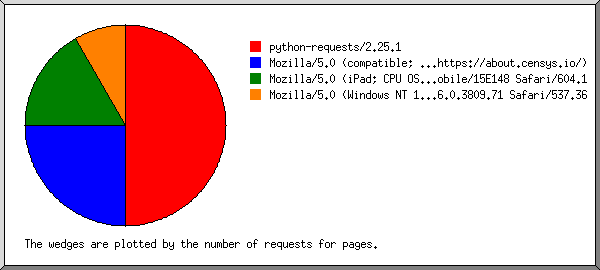
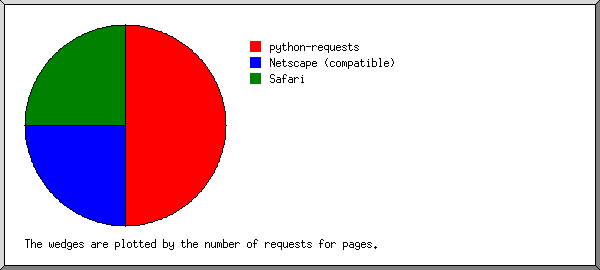
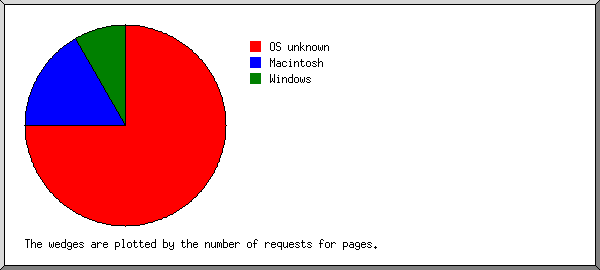
 ) represents 1 request for a page.