 Web Server Statistics for wcia.trademore.com.ng
Program started on Sun, Sep 26 2021 at 1:14 PM.
Analyzed requests from Tue, Sep 21 2021 at 1:24 PM to Sat, Sep 25 2021 at 5:39 PM (4.18 days).
Web Server Statistics for wcia.trademore.com.ngProgram started on Sun, Sep 26 2021 at 1:14 PM.
Analyzed requests from Tue, Sep 21 2021 at 1:24 PM to Sat, Sep 25 2021 at 5:39 PM (4.18 days).
(Go To: Top | General Summary | Monthly Report | Daily Summary | Hourly Summary | Domain Report | Organization Report | Browser Report | Browser Summary | Operating System Report | Status Code Report | File Size Report | File Type Report | Directory Report | Request Report)
Successful requests: 21
Average successful requests per day: 4
Successful requests for pages: 11
Average successful requests for pages per day: 2
Failed requests: 9
Distinct files requested: 7
Distinct hosts served: 14
Data transferred: 6.29 kilobytes
Average data transferred per day: 1.51 kilobytes
(Go To: Top | General Summary | Monthly Report | Daily Summary | Hourly Summary | Domain Report | Organization Report | Browser Report | Browser Summary | Operating System Report | Status Code Report | File Size Report | File Type Report | Directory Report | Request Report)
Each unit ( ) represents 1 request for a page.
| month | #reqs | #pages | |
|---|---|---|---|
| Sep 2021 | 21 | 11 |   |
Busiest month: Sep 2021 (11 requests for pages).
(Go To: Top | General Summary | Monthly Report | Daily Summary | Hourly Summary | Domain Report | Organization Report | Browser Report | Browser Summary | Operating System Report | Status Code Report | File Size Report | File Type Report | Directory Report | Request Report)
Each unit () represents 1 request for a page.
| day | #reqs | #pages | |
|---|---|---|---|
| Sun | 0 | 0 | |
| Mon | 0 | 0 | |
| Tue | 14 | 4 |  |
| Wed | 0 | 0 | |
| Thu | 1 | 1 | |
| Fri | 4 | 4 | |
| Sat | 2 | 2 | |
(Go To: Top | General Summary | Monthly Report | Daily Summary | Hourly Summary | Domain Report | Organization Report | Browser Report | Browser Summary | Operating System Report | Status Code Report | File Size Report | File Type Report | Directory Report | Request Report)
Each unit () represents 1 request for a page.
| hour | #reqs | #pages | |
|---|---|---|---|
| 0 | 0 | 0 | |
| 1 | 1 | 1 | |
| 2 | 0 | 0 | |
| 3 | 0 | 0 | |
| 4 | 0 | 0 | |
| 5 | 0 | 0 | |
| 6 | 0 | 0 | |
| 7 | 0 | 0 | |
| 8 | 0 | 0 | |
| 9 | 0 | 0 | |
| 10 | 0 | 0 | |
| 11 | 0 | 0 | |
| 12 | 0 | 0 | |
| 13 | 14 | 4 | |
| 14 | 0 | 0 | |
| 15 | 0 | 0 | |
| 16 | 0 | 0 | |
| 17 | 3 | 3 | |
| 18 | 2 | 2 | |
| 19 | 0 | 0 | |
| 20 | 1 | 1 | |
| 21 | 0 | 0 | |
| 22 | 0 | 0 | |
| 23 | 0 | 0 |
(Go To: Top | General Summary | Monthly Report | Daily Summary | Hourly Summary | Domain Report | Organization Report | Browser Report | Browser Summary | Operating System Report | Status Code Report | File Size Report | File Type Report | Directory Report | Request Report)
Listing domains, sorted by the amount of traffic.
| #reqs | %bytes | domain |
|---|---|---|
| 21 | 100% | [unresolved numerical addresses] |
(Go To: Top | General Summary | Monthly Report | Daily Summary | Hourly Summary | Domain Report | Organization Report | Browser Report | Browser Summary | Operating System Report | Status Code Report | File Size Report | File Type Report | Directory Report | Request Report)
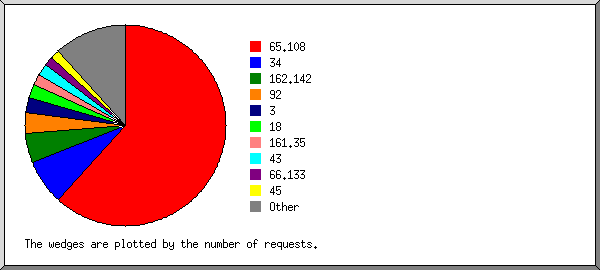
Listing organizations, sorted by the number of requests.
| #reqs | %bytes | organization |
|---|---|---|
| 5 | 34.68% | 161.35 |
| 4 | 38.67% | 162.142 |
| 3 | 4.05% | 3 |
| 2 | 1.99% | 23 |
| 2 | 2.70% | 64.78 |
| 1 | 6.94% | 61.164 |
| 1 | 1.35% | 52 |
| 1 | 1.35% | 34 |
| 1 | 6.94% | 178.128 |
| 1 | 1.35% | 18 |
(Go To: Top | General Summary | Monthly Report | Daily Summary | Hourly Summary | Domain Report | Organization Report | Browser Report | Browser Summary | Operating System Report | Status Code Report | File Size Report | File Type Report | Directory Report | Request Report)
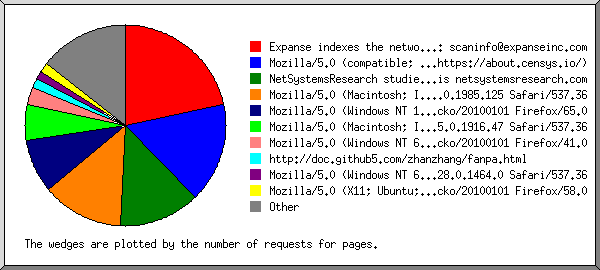
Listing browsers with at least 1 request for a page, sorted by the number of requests for pages.
| #reqs | #pages | browser |
|---|---|---|
| 6 | 6 | Mozilla/5.0 (Windows NT 10.0; Win64; x64; rv:65.0) Gecko/20100101 Firefox/65.0 |
| 2 | 2 | Mozilla/5.0 (compatible; CensysInspect/1.1; +https://about.censys.io/) |
| 1 | 1 | Mozilla/5.0 (Windows NT 10.0; Win64; x64) AppleWebKit/537.36 (KHTML, like Gecko) Chrome/63.0.3239.108 Safari/537.36 |
| 10 | 0 | [not listed: 2 browsers] |
(Go To: Top | General Summary | Monthly Report | Daily Summary | Hourly Summary | Domain Report | Organization Report | Browser Report | Browser Summary | Operating System Report | Status Code Report | File Size Report | File Type Report | Directory Report | Request Report)
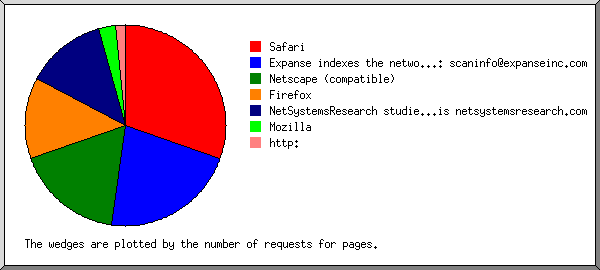
Listing browsers with at least 1 request for a page, sorted by the number of requests for pages.
| # | #reqs | #pages | browser |
|---|---|---|---|
| 1 | 6 | 6 | Firefox |
| 6 | 6 | Firefox/65 | |
| 2 | 10 | 2 | Netscape (compatible) |
| 3 | 1 | 1 | Safari |
| 1 | 1 | Safari/537 | |
| 2 | 0 | [not listed: 1 browser] |
(Go To: Top | General Summary | Monthly Report | Daily Summary | Hourly Summary | Domain Report | Organization Report | Browser Report | Browser Summary | Operating System Report | Status Code Report | File Size Report | File Type Report | Directory Report | Request Report)
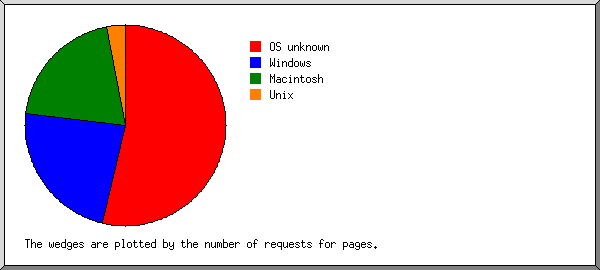
Listing operating systems, sorted by the number of requests for pages.
| # | #reqs | #pages | OS |
|---|---|---|---|
| 1 | 7 | 7 | Windows |
| 7 | 7 | Windows NT | |
| 2 | 12 | 2 | OS unknown |
(Go To: Top | General Summary | Monthly Report | Daily Summary | Hourly Summary | Domain Report | Organization Report | Browser Report | Browser Summary | Operating System Report | Status Code Report | File Size Report | File Type Report | Directory Report | Request Report)

Listing status codes, sorted numerically.
| #reqs | status code |
|---|---|
| 21 | 200 OK |
| 9 | 404 Document not found |
(Go To: Top | General Summary | Monthly Report | Daily Summary | Hourly Summary | Domain Report | Organization Report | Browser Report | Browser Summary | Operating System Report | Status Code Report | File Size Report | File Type Report | Directory Report | Request Report)
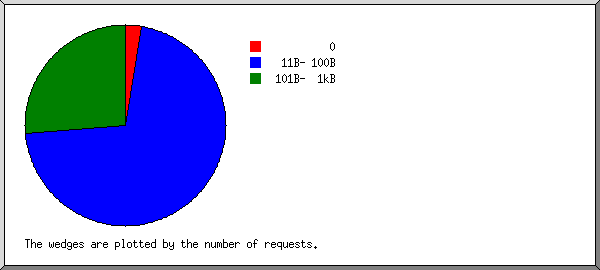
| size | #reqs | %bytes |
|---|---|---|
| 0 | 0 | |
| 1B- 10B | 0 | |
| 11B- 100B | 10 | 12.79% |
| 101B- 1kB | 11 | 87.21% |
(Go To: Top | General Summary | Monthly Report | Daily Summary | Hourly Summary | Domain Report | Organization Report | Browser Report | Browser Summary | Operating System Report | Status Code Report | File Size Report | File Type Report | Directory Report | Request Report)

Listing extensions with at least 0.1% of the traffic, sorted by the amount of traffic.
| #reqs | %bytes | extension |
|---|---|---|
| 11 | 87.21% | [directories] |
| 10 | 12.79% | [no extension] |
(Go To: Top | General Summary | Monthly Report | Daily Summary | Hourly Summary | Domain Report | Organization Report | Browser Report | Browser Summary | Operating System Report | Status Code Report | File Size Report | File Type Report | Directory Report | Request Report)
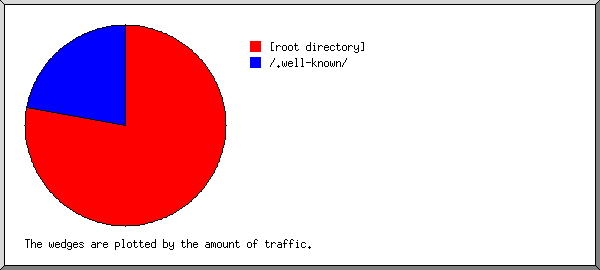
Listing directories with at least 0.01% of the traffic, sorted by the amount of traffic.
| #reqs | %bytes | directory |
|---|---|---|
| 11 | 87.21% | [root directory] |
| 10 | 12.79% | /.well-known/ |
(Go To: Top | General Summary | Monthly Report | Daily Summary | Hourly Summary | Domain Report | Organization Report | Browser Report | Browser Summary | Operating System Report | Status Code Report | File Size Report | File Type Report | Directory Report | Request Report)
Listing files with at least 20 requests, sorted by the number of requests.
| #reqs | %bytes | last time | file |
|---|---|---|---|
| 21 | 100% | Sep/25/21 5:39 PM | [not listed: 5 files] |